


A Practical Guide to Scaling Medusa with Kubernetes Autoscalers


As your Medusa.js e-commerce platform grows, performance and reliability depend on how well it scales under load. Kubernetes provides native tools like the Horizontal Pod Autoscaler (HPA) and KEDA to automatically adjust resources based on real-time demand. In this guide, you’ll learn how to configure Medusa for horizontal scaling in Kubernetes, using Prometheus, cAdvisor, and HPA - ensuring your store remains responsive even during peak traffic periods.
Prerequisites for Medusa Autoscaling on Kubernetes
Before implementing autoscaling, ensure that your monitoring and metric systems are in place.
Required Tools: cAdvisor, Prometheus, and KEDA
To make HPA and KEDA work efficiently, you’ll need:
- cAdvisor – collects container-level CPU and memory metrics.
- Prometheus – scrapes, stores, and visualizes time-series metrics.
- Prometheus Adapter or KEDA – exposes those metrics to the HPA.
This setup is essential to achieve a reliable, responsive scaling mechanism that monitors pod and container utilization with fine-grained metric resolution (ideally 1 second or less).
Setting Up Metrics for HPA
Configuring cAdvisor for container-level metrics
cAdvisor (Container Advisor) is a running daemon that provides per-container resource usage data. It collects and exports information about all containers running on a host.
Key configuration tips:
- Avoid collecting all metrics to reduce resource consumption.
- Adjust collection intervals according to your scaling sensitivity.
  - --allow_dynamic_housekeeping=false
  - --housekeeping_interval=1s
  - --max_housekeeping_interval=2s
These flags ensure you get up-to-date metrics while keeping overhead low.
Prometheus Configuration for Scraping cAdvisor Data
Prometheus collects metrics from cAdvisor and stores them for HPA or KEDA to consume. Below is a sample configuration to scrape and relabel container metrics efficiently:
scrape_configs:
  - job_name: cadvisor
    scrape_interval: 1s
    static_configs:
      - targets: ["cadvisor.cadvisor.svc.cluster.local:8080"]
    metric_relabel_configs:
      - source_labels: [container_label_io_kubernetes_pod_namespace]
        target_label: namespace
      - source_labels: [container_label_io_kubernetes_pod_name]
        target_label: pod
      - source_labels: [container_label_io_kubernetes_container_name]
        target_label: container
      - source_labels: [container_label_io_kubernetes_pod_node_name]
        target_label: node
      - regex: container_label_.*
        action: labeldrop
Tip: Use a 1-second scrape interval for real-time scaling accuracy, but monitor your Prometheus load — frequent scrapes can impact cluster performance.
Using Prometheus Adapter to Expose Custom Metrics
Prometheus Adapter acts as a bridge between Prometheus and the Kubernetes HPA. It translates Prometheus metrics into Kubernetes-readable custom metrics that HPA can act upon.
Example configuration for CPU and memory metrics:
resource:
  cpu:
    containerQuery: |
      sum by (<<.GroupBy>>) (
        rate(container_cpu_usage_seconds_total{container!="",<<.LabelMatchers>>}[5s])
      )
    nodeQuery: |
      sum  by (<<.GroupBy>>) (
        rate(node_cpu_seconds_total{mode!="idle",mode!="iowait",mode!="steal",<<.LabelMatchers>>}[3m])
      )
    resources:
      overrides:
        node:
          resource: node
        namespace:
          resource: namespace
        pod:
          resource: pod
    containerLabel: container
  memory:
    containerQuery: |
      sum by (<<.GroupBy>>) (
        avg_over_time(container_memory_working_set_bytes{container!="",<<.LabelMatchers>>}[5s])
      )
    nodeQuery: |
      sum by (<<.GroupBy>>) (
        avg_over_time(node_memory_MemTotal_bytes{<<.LabelMatchers>>}[3m])
        -
        avg_over_time(node_memory_MemAvailable_bytes{<<.LabelMatchers>>}[3m])
      )
    resources:
      overrides:
        node:
          resource: node
        namespace:
          resource: namespace
        pod:
          resource: pod
    containerLabel: container
This configuration exposes per-pod resource metrics that HPA can use to make scaling decisions.
Scaling Medusa with KEDA
How KEDA Integrates with Kubernetes HPA
KEDA (Kubernetes Event-Driven Autoscaler) enhances Kubernetes autoscaling by allowing scaling based on external events - for example, message queue depth, API requests, or Prometheus metrics.
KEDA works alongside HPA to provide fine-grained, event-driven scaling for your Medusa backend.
Below is a sample configuration for scaling Medusa using KEDA with Prometheus as the metric source:
apiVersion: keda.sh/v1alpha1
kind: ScaledObject
metadata:
  name: medusa-backend
spec:
  scaleTargetRef:
    name: medusa-backend
  pollingInterval: 1
  cooldownPeriod: 60
  minReplicaCount: 3
  maxReplicaCount: 10
  triggers:
    - type: prometheus
      metricType: AverageValue
      metadata:
        serverAddress: <http://prometheus-server.default.svc.cluster.local:80>
        metricName: avg_cpu_usage
        threshold: "0.5"
        query: |
          sum by (pod) (rate(container_cpu_usage_seconds_total{pod=~"medusa-backend-.*", container!=""}[5s]))
This YAML defines a ScaledObject that dynamically adjusts Medusa’s replica count based on CPU usage metrics scraped by Prometheus.
Fine-Tuning Kubernetes HPA
kube-controller-manager Parameters for Faster Scaling
The kube-controller-manager is a core Kubernetes component that controls how quickly HPA reacts to metric changes.
By tuning its parameters, you can make scaling nearly instantaneous - for example, achieving a 5-second response time to CPU utilization spikes.
Ensure you’ve optimized:
--horizontal-pod-autoscaler-sync-period=5s
Lowering this interval makes the autoscaler evaluate conditions more frequently, but note that some managed Kubernetes distributions may restrict access to these flags.
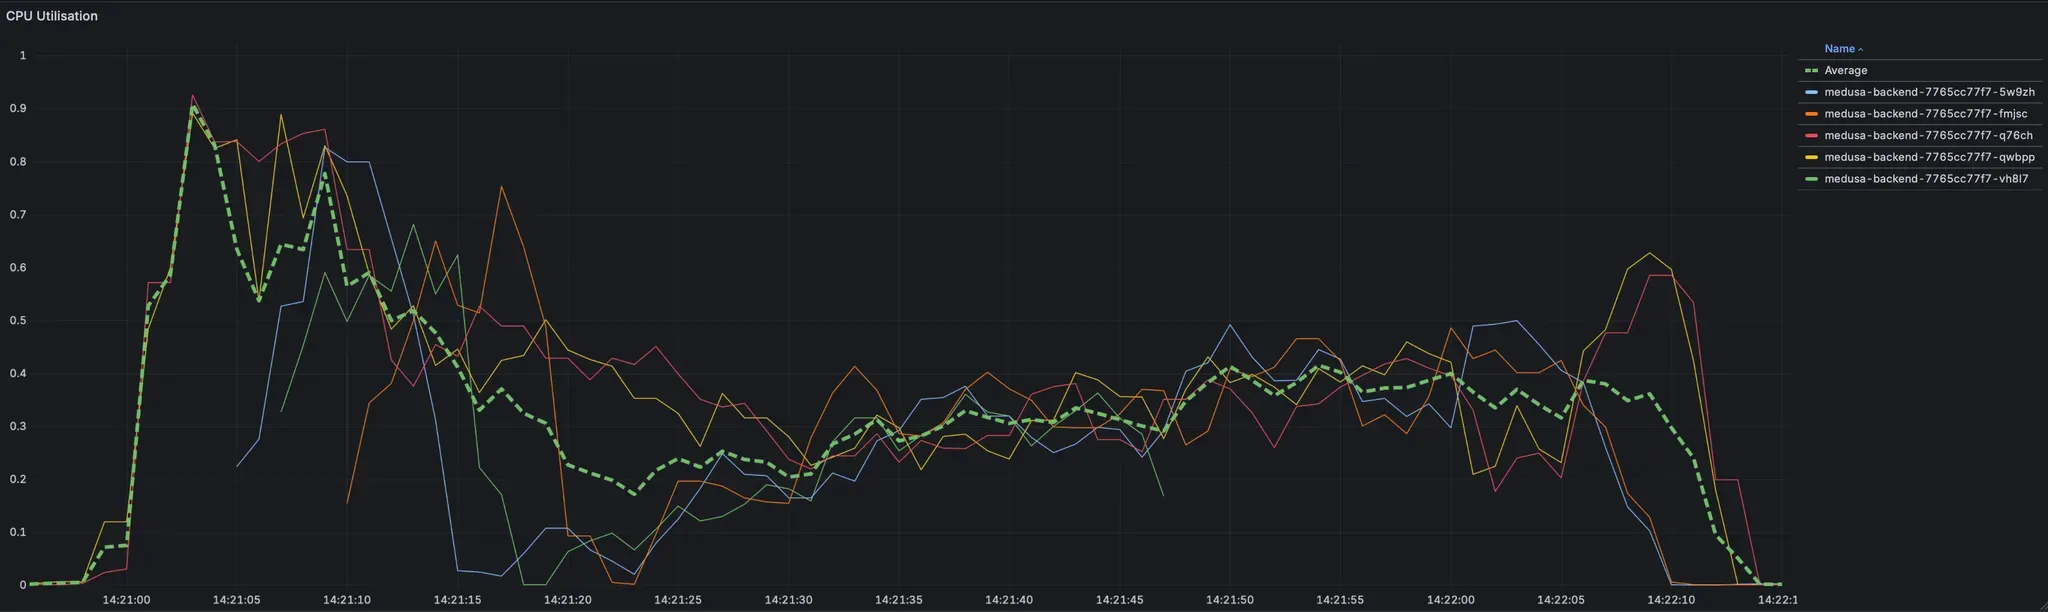
Visualizing Scaling with Grafana
Grafana dashboards can help you track CPU utilization, pod counts, and scaling behavior in real time. Below is an example visualization showing how HPA scales pods in and out based on CPU load.
This visualization also highlights the importance of minimizing container startup and readiness probe times, which directly affect how quickly new replicas become active.
Best Practices and Common Pitfalls
Optimize Startup Times and Readiness Probes
- Ensure Medusa starts and becomes ready as quickly as possible.
- Use readiness probes to signal when pods can receive traffic.
- Long startup times can delay scaling and degrade performance.
Selecting the Right Scaling Metrics
- CPU utilization is common, but not always optimal.
- Consider custom business metrics (e.g., requests per second, queue depth).
Dealing with HPA Sync Delays
- The default HPA sync period is 15 seconds, which might be too slow for bursty workloads.
- Decreasing it improves responsiveness but can increase API traffic and controller load.
Conclusion
Implementing HPA and KEDA for your Medusa.js e-commerce platform ensures efficient scaling, better performance under load, and optimal resource utilization.
Key takeaways:
- Always configure readiness probes and optimize startup times.
- Choose scaling metrics carefully - CPU isn’t always the best indicator.
- Monitor your autoscaler’s responsiveness using Grafana and Prometheus.
- Test your setup under realistic load scenarios to validate scaling behavior.
With the right configuration, Kubernetes can make your Medusa deployment both resilient and self-scaling, ensuring you’re always ready for traffic spikes.
FAQ: Scaling Medusa in Kubernetes
Q1: What is the best way to scale Medusa on Kubernetes?
A1: Use Kubernetes HPA with metrics from Prometheus and cAdvisor, or event-driven scaling through KEDA for more flexibility.
Q2: Does Medusa support autoscaling natively?
A2: Medusa itself doesn’t manage scaling, but it runs well in Kubernetes environments that use HPA or KEDA.
Q3: Which metrics should I track for autoscaling?
A3: Start with CPU and memory usage; consider adding metrics like request rate, queue size, or API latency for advanced control.
Q4: How can I monitor Medusa’s scaling performance?
A4: Integrate Prometheus with Grafana dashboards to visualize pod utilization and replica changes in real time.
Q5: What’s the difference between HPA and KEDA?
A5: HPA relies on internal Kubernetes metrics, while KEDA extends it to external sources like Prometheus queries or event systems.


